Enabling users to create indicators and even free-form drawings on top of financial charts is a great feature of amCharts 5 Stock Chart. With version 5.3 we are taking it one step further. Now you can preserve these annotations and indicators in a structured form and restore them in future sessions.
You can retrieve user-added content in the object or JSON form, store it in your database and bring it back for further viewing and editing the next time users load the stock chart.
For details on how to use this great new addition, please refer to this tutorial in the documentation.
Discover all the great features of amCharts 5: Stock Chart here.
Starting with version 5.3.0 you can create amCharts 5 charts from a JSON configuration. This enables you to store chart definitions anywhere text can be stored: databases, cloud storage, local file system or even browser’s memory.
It’s important to note, that while you can serialize and parse chart settings and properties, more advanced amCharts 5 features like events and adapters cannot be serialized at this point.
For more information on serialization in amCharts 5 please refer to this tutorial.
Starting with amCharts version 5.5 we added a GrainPattern concept to our library which allows filling slices, columns and any other object with nice grainy patterns. Combined with gradients (yes starting with v5.5, you can have both gradient and pattern on the same object!) you can achieve some really good-looking designs, like this one:
Note that there are three stops – two black and one empty. If only one black stop was added the inner edge of a slice would not be as dark as it is now, as radial gradient starts at the center of a circle, which we do not see as it’s a donut chart in our case. The last stop is empty, which means that original slice color will be used.
Next, we create a GrainPattern and set it as a fillPattern for slices template:
Besides all other settings available for all Patterns, GrainPattern has the following settings:
size – the size of a grain pixel, default 1.
minOpacity – minimum opacity of noise pixel, default 0.
maxOpacity – maximum opacity of noise pixel, default 0.3.
density – density of noise. 1 means each pixel will have another pixel painted over with random opacity from `minOpacity` to `maxOpacity`.
colors – array of colors used for noise. Default is just a single black color. If, for example you want a lot of black and some white noise, add several black colors and one white color, like: [am5.color(0x000000), am5.color(0x000000), am5.color(0xffffff)]
horizontalGap – horizontal gap between noise pixels (in size, not in pixels). Default 0.
verticalGap – vertical gap between noise pixels (in size, not in pixels). Default 0.
For your convenience we’ve created this grain editor:
The Stochastic Momentum Index (SMI) is a technical indicator used in financial analysis to measure the momentum of a security’s price movement.
It combines elements of the Stochastic Oscillator and the Rate of Change (ROC) to provide a smoother and more responsive momentum indicator. The SMI oscillates between +100 and -100 and is calculated based on the difference between the closing price and the midpoint of the price range over a specified period.
This indicator helps traders and investors identify potential trend reversals and overbought/oversold conditions in the market, as well as to confirm existing trends. Positive values indicate bullish momentum, while negative values suggest bearish momentum, making it a valuable tool for technical analysis and trend-following strategies in financial markets.
amCharts implementation
amCharts 5: Stock Chart has a built-in support for Stochastic Momentum Index Indicator since version 5.5.3.
amCharts 5: Stock Chart comes bundled with a lot of technical indicators. Some of them use Oversold/Overbought range.
These are:
Commodity Channel Index
Relative Strength Index
Stochastic Momentum Index
Stochastic Oscillator
Williams R
Starting from version 5.5.3 the Oversold and Overbought limits can be directly manipulated by dragging grip on the respective lines in the chart itself.
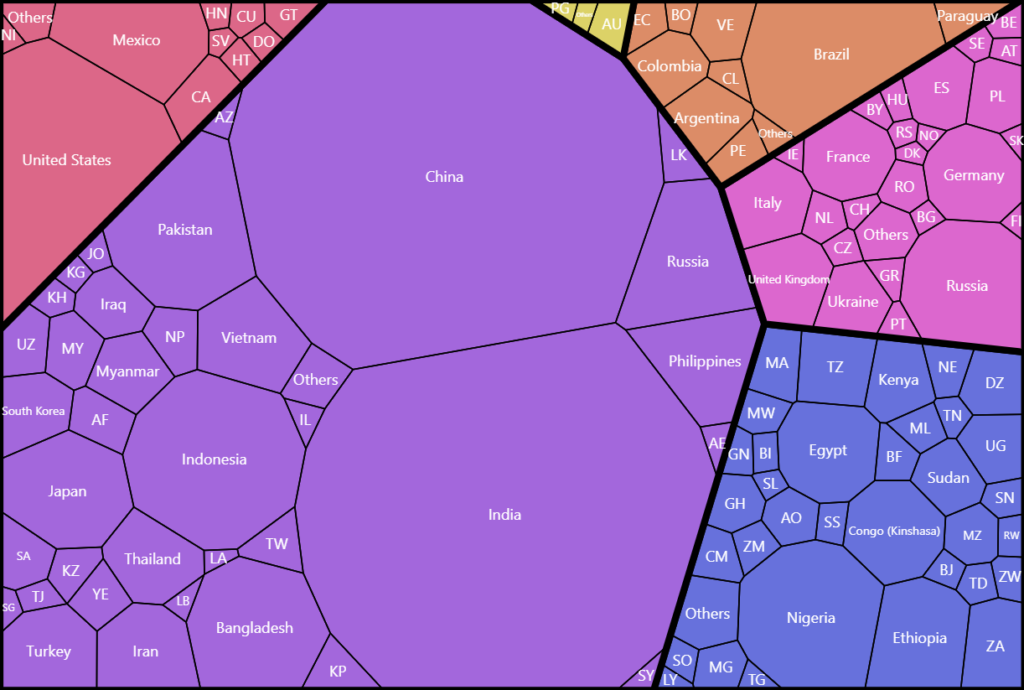
A Voronoi treemap is a data visualization technique used to represent hierarchical or categorized information in a structured and space-filling manner.
It partitions a defined area into cells that are based on the Voronoi diagram, which allocates space to each category or element in a way that minimizes the distance to its associated data points. The result is a treemap where the size and shape of each cell correspond to the value or hierarchy of the represented data, allowing for efficient and aesthetically pleasing visualization of complex datasets.
Voronoi treemaps are particularly useful for displaying hierarchical data, such as file systems, organizational structures, or market segmentation, as they provide a clear and intuitive way to understand the relationships and proportions of data categories within a given space.
amCharts implementation
amCharts has full support for Voronoi Treemaps – both square and circular.
During recent months, certain information has come to our attention that compares amCharts to other libraries in terms of license cost. Since the information appeared to be manipulated, we decided to run our own – unbiased analysis. Here’s how amCharts compares to FusionCharts in terms of license fees and total cost of ownership.
Methodology used
Project scenarios
The price analysis is conducted using several common project scenarios that take project type, scope, developer count into account.
License choice
For both vendors, the most cost-effective license out of their respective offerings is chosen.
License types
At the moment of this writing:
amCharts offers only pay-once perpetual license. One-time fee gets a lifetime of usage.
FusionCharts offers two types of licenses:
Pay-once perpetual license. One-time fee for a lifetime usage.
Annual subscription. Payments need to be made once a year for as long as the library is used.
For the sake of calculating total cost of ownership, we have calculated all license types on offer – both for initial payment, and for continued usage for up to 5 years.
Product bundles
amCharts offers two main products: amCharts 5: Charts (which includes all main chart types except geographical maps) and amCharts 5: Maps (which is an add-on needed to create geographical maps).
FusionCharts offers one package – FusionCharts XT – which includes all main chart types including geographical maps.
Even though not all customers need geographical maps, we have summed up both of the amCharts products – Charts and Maps – in all calculations, so that it compares to the FusionCharts XT bundle.
Takeaway: amCharts offers a more flexible pricing in terms of product bundles, as customers who do not need geographical maps can reduce the overall price by not acquiring amCharts 5: Maps add-on.
Product availability
amCharts 5: Stock Chart product was not included in calculations and scenarios because FusionCharts does not offer any stock/trading charting product with equivalent analytical capabilities, typically found in financial charts.
Product features
The aim of this document is to compare pricing of the comparable product packages from different vendors.
It does not aim to compare features of those products, as we assume someone choosing between chart library vendors has already determined that both products meet their requirements.
Limits on developer seats
amCharts
FusionCharts
amCharts does not limit number of developers working with its libraries with any of the licenses.
FusionCharts limits developers working with its libraries from 1 (one) to 10 (ten) depending on the license.
Takeaway: amCharts provides a safer fixed and future-proof pricing, whereas companies using FusionCharts might experience additional costs if/when the team grows. Initial purchase cost might increase dramatically for FusionCharts users if the team consists of more than 5-10 developers.
Support service
There are certain differences in how technical support service is calculated by both vendors:
amCharts
FusionCharts
amCharts includes 12 months of professional support service with all licenses, except the entry level – Single website license.
FusionCharts does not include professional support service with any of its licenses and must be acquired separately if needed.
Optional professional support service subscription is available.
Optional professional support service subscription is available.
Since not all projects and teams require technical support service, we have included separate calculations of total cost of ownership when purchasing licenses alone, and with optional professional support service subscription.
Scenario #1: Interactive charts and maps on public web site
Project description
A company needs to augment its public-facing website with various charts and maps.
# of projects websites: 1
# of developers involved: 1
License choice
Vendor
amCharts
FusionCharts
FusionCharts
Product(s)
amCharts 5: Charts + amCharts 5: Maps
FusionCharts XT
FusionCharts XT
License required
Single website
Basic
Basic
License model
Perpetual
Perpetual
Subscription
# of projects included
1
1
1
# of developers included
Unlimited
1
1
# of licenses/dev seats needed
1
1
1
License fee
$2701 (180 + 90)
$1,099
$439
License renewal fee
–
–
$439
Annual support service fee
$6751 (450 + 225)
$499
$499
1 – amCharts prices include two products: amCharts 5: Charts and amCharts 5: Maps
Takeaway: With a single developer implementing interactive charts and maps into a public website without optional technical support subscription, amCharts comes out at astonishingly 400%-800% cheaper than FusionCharts over 5 year period of operation.
For situations which require continuous technical support subscription and assistance, both vendors come out at roughly the same 5-year cost of ownership.
Scenario #2: An SaaS tool
Project description
An online customer management platform with multiple users/servers/developers. Displays multiple reports with various charts and maps.
# of projects websites: 1
# of developers involved: 3
License choice
Vendor
amCharts
FusionCharts
FusionCharts
Product(s)
amCharts 5: Charts + amCharts 5: Maps
FusionCharts XT
FusionCharts XT
License required
Application / SaaS
Enterprise 2
Enterprise 2
License model
Perpetual
Perpetual
Subscription
# of projects included
1
1
1
# of developers included
Unlimited
10
10
# of licenses/dev seats needed
1
1
1
License fee
$1,8001 (1,200 + 600)
$8,399
$3,399
License renewal fee
–
–
$3,399
Annual support service fee
$6751 (450 + 225)
$499
$499
1 – amCharts prices include two products: amCharts 5: Charts and amCharts 5: Maps 2 – Enterprise license chosen for FusionCharts because Pro license does not allow SaaS usage
Takeaway: For a small team working on an SaaS product, amCharts licenses come a few times cheaper than FusionCharts, both with or without support subscription.
The above calculations show that FusionCharts subscription model can come at almost staggering 1000% the total cost of amCharts in some licensing setups.
For teams bigger than 10 developers, the cost of FusionCharts license may increase by orders of magnitude, whereas amCharts no-limit licenses will retain the same fixed pricing regardless of the team size.
Scenario #3: Redistributable products
Project description
Company develops 3 re-distributable web apps that are sold and installed on customer’s premises and require charts/maps in them.
# of products: 3
# of developers involved per project: 3
License choice
Vendor
amCharts
FusionCharts
FusionCharts
Product(s)
amCharts 5: Charts + amCharts 5: Maps
FusionCharts XT
FusionCharts XT
License required
OEM
Pro
Pro
License model
Perpetual
Perpetual
Subscription
# of projects included
Unlimited
1
1
# of developers included
Unlimited
5
5
# of licenses/dev seats needed
1
3 2
3 2
License fee
$4,4601 (2,975 + 1,485)
$14,397 (4,799 x 3)
$5,697 (1,899 x 3)
License renewal fee
–
–
$5,697
Annual support service fee
$1,7051 (1,148 + 557)
$499
$499
1 – amCharts prices include two products: amCharts 5: Charts and amCharts 5: Maps 2 – amCharts OEM license covers any number of projects, whereas FusionCharts Pro license allows only one project, so 3 licenses would need to be purchased, multiplying the costs.
Takeaway: For a company working on redistributable products (e.g. CRM, CMS, etc.), amCharts comes at significantly less cost than FusionCharts, because amCharts flat-rate OEM license offers unlimited number of projects and developers, whereas FusionCharts Pro license limits to 1 project per license, thus requiring purchase of multiple licenses.
The FusionCharts total fees grow significantly with the number of projects (1 project per license) or the team (5 developer seats per license), whereas amCharts keep the same flat license price regardless of number of projects or developers.
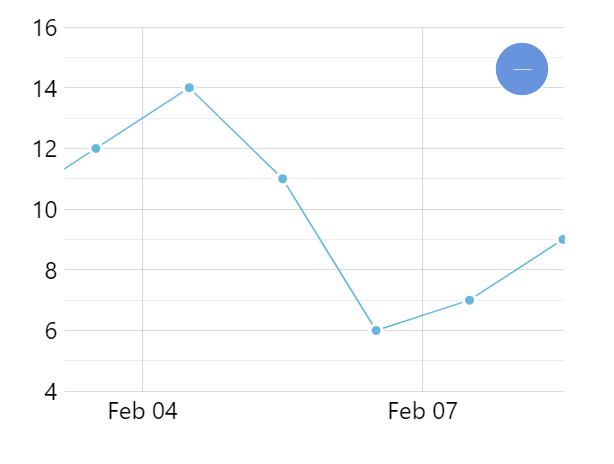
Maps can look messy with too many markers, affecting user experience and usability. To tackle this, amCharts 5: Maps – starting with version 5.5.6 – introduces a ClusteredPointSeries.
This feature neatly groups closely packed markers into a single “group” marker, simplifying the interface. It also handles clustering and unclustering automatically when zooming in on the map.
How to enable it?
If you already have a MapChart with a MapPointSeries set up, you’re almost there. To enable clustering, all you need is:
Make sure you’re running version 5.5.6 or later.
Change the type of your series to ClusteredPointSeries.
Define how your group bullet looks like.
Enjoy!
If you don’t yet have an amCharts-driven interactive map, now is a good time to create one 😉.
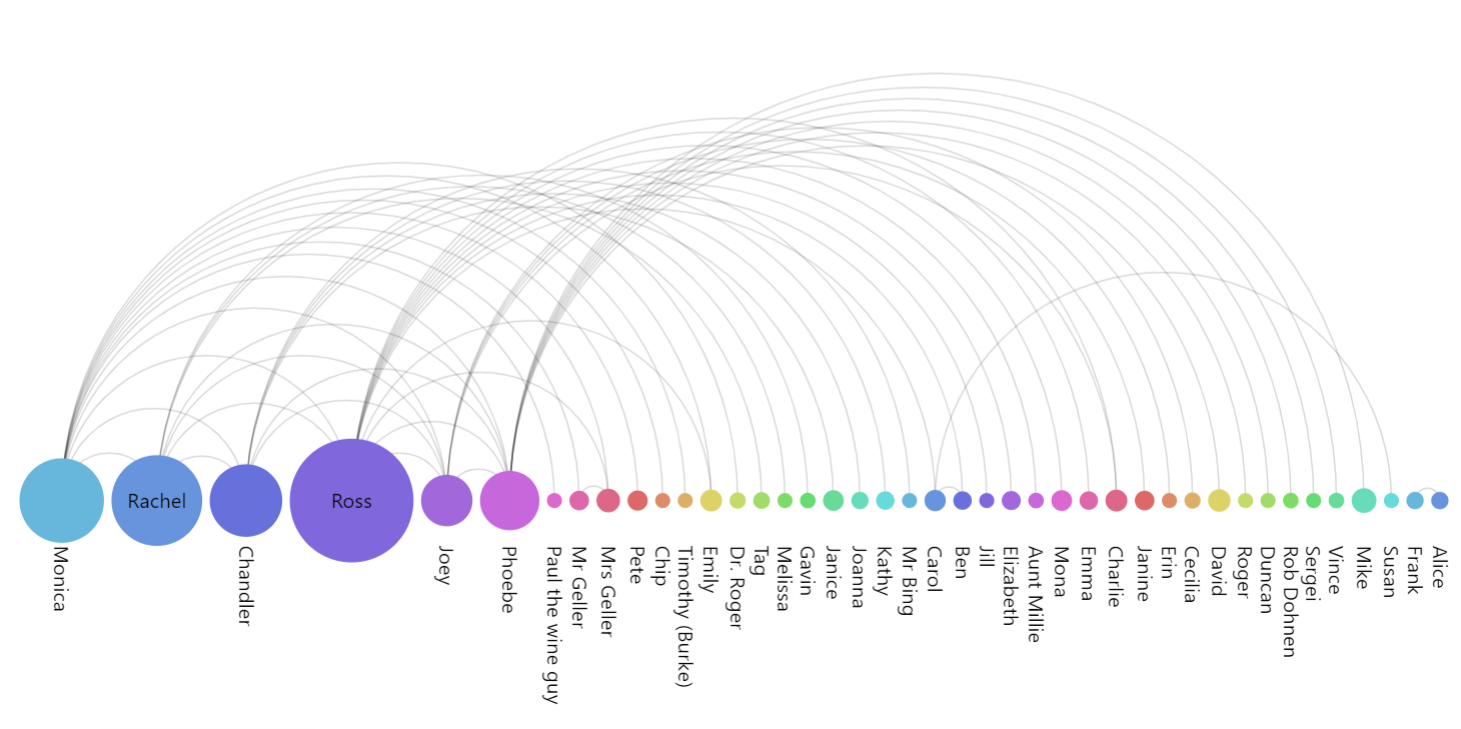
An arc diagram is a visualization technique that represents relationships or connections between entities. Typically used in graph theory and network analysis, an arc diagram displays nodes as points along a straight line or axis, with arcs or curves connecting pairs of nodes to represent relationships.
The bullets the arcs connect can vary in size to display their relative value. The arcs themselves can vary in thickness or color to convey additional information, making it a useful tool for illustrating complex networks and dependencies in a concise and visually intuitive manner.
amCharts implementation
amCharts 5: Charts fully supports Arc Diagrams – both horizontal (as in an example above) and vertical – as part of the Flow charts family.
Besides classic Arc Diagram features, there’s also built-in support for toggling of individual nodes.
amCharts 5 allows using any element – complex or basic – as a bullet in its charts. You can add a simple Circle element, or the whole other chart as a bullet – whatever is needed.
We have whipped together a simple to use bullet editor, which supports several non-common complex bullet types such as flag, pin, star and even custom shape using SVG paths.
Via simple user interface you can tweak bullet appearance like rotation, stroke width, etc., then generate completely functional bullet code you can copy and paste into your chart config.
A chart grid is a visual framework of intersecting horizontal and vertical lines on a graph or chart, providing a structured reference for interpreting data points and trends.
Normally, a typical XY chart would have a horizontal axis and a vertical axis, with grid line marking its categories, dates, or value increments.
This might create an issue for data-heavy charts, as their grid might become cluttered with a lot of lines and labels.
Charts solve this, by omitting some of the grid/labels. For example, on a chart with a Date Axis, it might display only grid for each month instead, when fully zoomed out.
In amCharts this process is controlled by axis renderer’s settings, such as minGridDistance.
However, concealing grid lines may diminish the ease with which a chart viewer can discern the scale and establish connections between individual data points in a series and their corresponding scale or category.
That’s where minor grid comes in!
What is minor grid?
Minor grid – when enabled – will show additional grid lines (and optionally labels) – usually less visually prominent – for skipped periods.
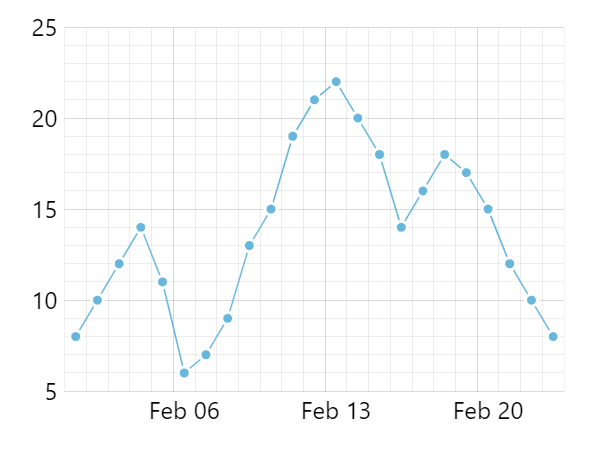
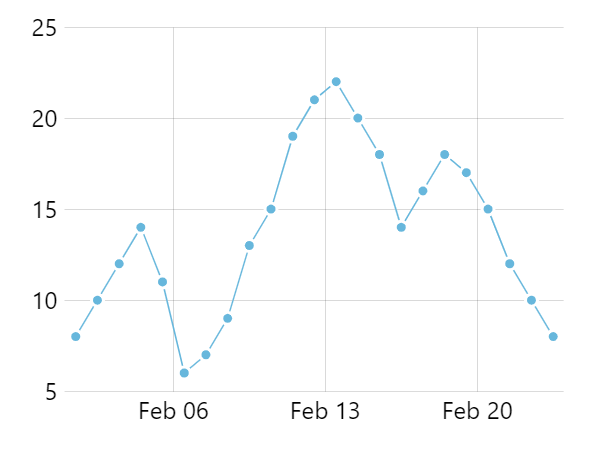
Regular grid + minor grid
Regular grid
The minor grid enhances the perception of scale and the relationship of data to axis increments, without introducing excessive visual clutter to the chart.
amCharts implementation
Enabling minor grid
Enabling minor grid in an amCharts charts is as easy as setting minorGridEnabled: true in the settings of an axis. For example:
The axis renderer itself will intelligently determine increments at which the minor grid lines are placed, and will ensure that the chart is still not to overcrammed with grid.
Minor grid effect on placement of axis labels
Normally, labels for a multi-period axis cell (when each increment includes several periods/categories) would be placed centered on the grid line.
Enabling minor grid would instead center the starting label on the first minor cell, so its clear which period or category it represents.
Regular grid + minor grid
Regular grid
Minor grid labels
Minor grid does not display any labels by default.
They can be easily enabled with another axis renderer setting: minorLabelsEnabled: true.
The Volume Profile indicator or Volume-by-price is a tool used in technical analysis to illustrate the distribution of trading volume across different price levels during a specified period.
Instead of focusing solely on price movements, the Volume Profile displays horizontal bars along the side of the price chart, with each bar representing the volume traded at a specific price level. Traders use this information to identify key support and resistance levels, as well as areas of high or low trading activity.
Peaks in the Volume Profile can indicate significant price levels, while valleys may suggest areas with lighter trading interest. By incorporating volume data, the Volume Profile helps traders gain insights into market sentiment and potential price reversals, contributing to more informed trading decisions.
amCharts implementation
Starting with version 5.7.0 amCharts 5: Stock Chart has a Volume Profile Indicator built-in.
To add it, simply select it from the Indicators control.
Configuring
amCharts’ implementation of Volume Profile allows configuring it in a number of ways:
Users can set separate colors for volume down and up periods.
Configure the area of the value – the pricing area where most of trading volume occurred.
Width of the volume chart.
And most importantly select the way price ranges are calculated: either in fixed number of steps or specific increments, e.g. number of cents.
Legend
As with other amCharts indicators, Volume Profile comes with full legend support, which shows price range volume information on hover.
API
Volume Profile indicator can also be added via Stock Chart’s API:
Stock Chart by amCharts comes bundled with a lot of tools to annotate and analyze stock data – indicators and drawing tools.
Users can annotate the data displayed using wide array of tools from basic ones like lines and shapes and labels to complex like Fibonacci Retracement Levels and Regression lines.
They also have an ever-growing list of technical analytical tools, called indicators. They can be simple ones like Moving Average, or a complex but really useful ones like Volume Profile.
The issue is that those annotations are usually discarded when the page displaying the chart is reloaded, which brings us to a functionality that allows it to be retained.
A browser’s local storage is a client-side storage mechanism that allows web applications to store and retrieve data locally on a user’s device. It provides a way for websites to store small amounts of data, such as user preferences or session information, persistently on the user’s browser. This data remains available even after the user closes the browser, enabling a more seamless and personalized user experience across visits to the same website.
amCharts Stock Chart provides built in ways to save all currently added indicators and drawings to local storage for those to be retained across page reloads and even sessions.
There are a couple of ways to do that.
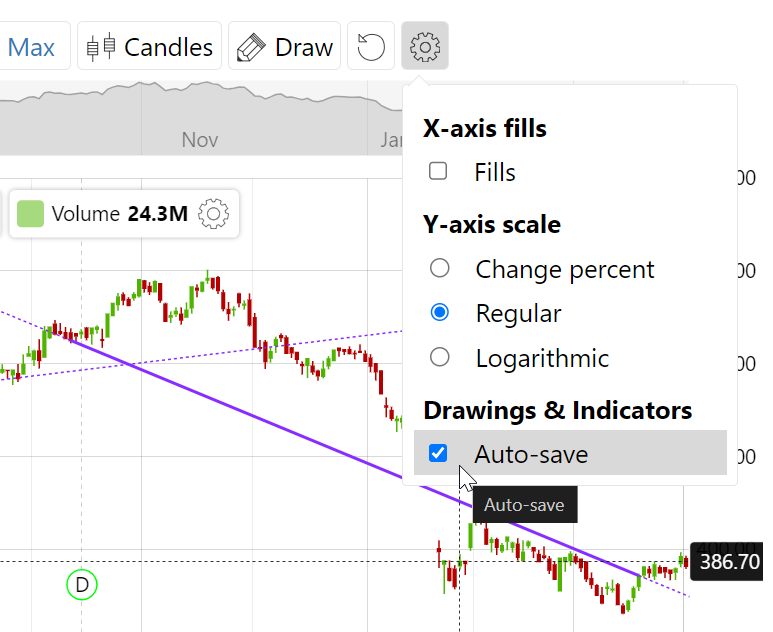
If the chart has a Settings Control added to its toolbar, it contains a checkbox, which allows automatic saving and restoring of all annotations.
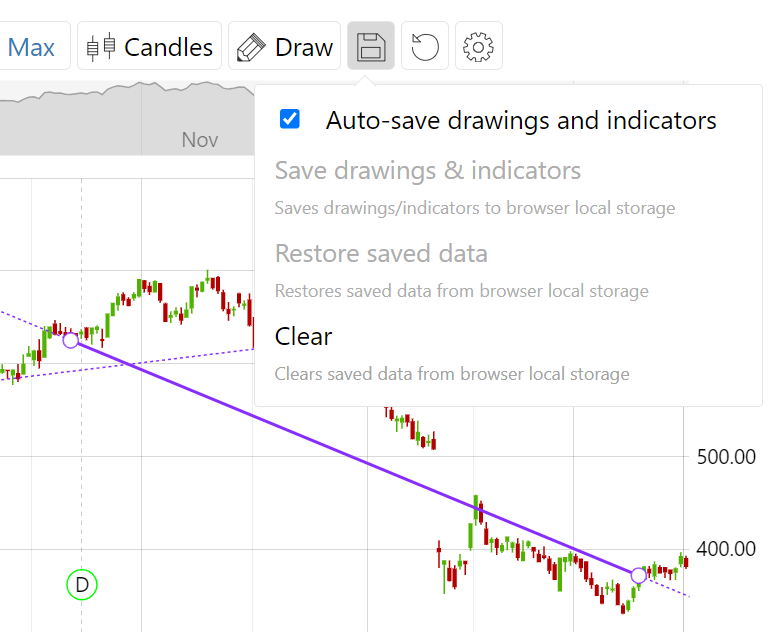
For more options, a Data Save Control can be added to the chart which, in addition to automatic save/restore – allows saving, restoring, and clearing annotation data manually.
This post looks at our Online Map Editor, what it can do, and how to do it.
Video Intro
What It Can Do?
We can use this tool to:
Create world and regional/country maps
Add lines, text labels, markers
Animate markers
Create data-bound heat maps and bubbles
Create stylish pixelated maps
Export as static image or embeddable code
Save edits to local browser memory to load and continue editing later
Choosing a Map and a Projection
The tool starts with a World map in a Mercator projection pre-selected for us.
Besides the world map, the Map Editor has maps for most of the countries, as well as regional maps such as Continents, Europe, etc.
To choose a map, simply go to Settings:
For a world map, some projections might look better than others.
Switching a projection is done via Settings menu as well.
Please note, switching to a map for United States, will automatically switch projection to “Albers USA”.
Choosing Between Dark and Light Themes
While any color on the map can be edited manually, the Map Editor comes with two pre-set themes: Dark and Light.
Switch between them via Settings menu:
Switching a theme will reset all edits we have made so far, so it’s best to choose the theme right from the start, then stick with it.
Configuring the Appearance of the Map Polygons
We can change default coloring and outlines for map polygons (countries or states) by selecting the Polygons tool.
We can modify colors, as well as some other parameters for each polygon individually, too.
For that we can either click the polygon and select corresponding parameters from the window that opens, or use Fill tool.
Creating Heat-Maps and Bubbles
The Editor can also generate value-bound heat maps where each polygon is colored based on its value.
It can also use the same data to generate value-sized bubbles for each polygon.
Before we can use this feature, we need to provide data for each country or state via Data tool.
We can can enter values by hand, use random values, or – in case of world map – use some pre-set sample data sets.
Once the data is ready, we can use it to generate heat maps and bubbles.
To generate heat maps, let’s use Polygons tool.
In it we can change the color of the polygon with lowest value, and the color for the one with the highest value.
Additionally, we can set a “neutral color” for those polygons that do not have value in data.
Check “Apply heat rules” box, to apply the heat map coloring to the map.
To create bubbles, let’s use Bubbles tool.
We can choose the shape of a bubble, minimum and maximum size, color, and border.
Click “Generate” button when ready.
Once generated, each bubble can be clicked upon (or selected from the Map items list) and edited individually.
Creating Pixel Maps
Probably the most visually-stunning feature of the Map Editor is its ability to generate “pixel maps”.
When used, it replaces polygons with tightly packed shapes – pixels.
Let’s use it Pixels tool to generate one.
As usually, we will be able to choose some options like pixel shape and size, gaps between pixels, outline color and opacity.
Click “Generate” button when ready.
Adding Lines
To add lines, let’s select Lines tool.
Once there, we’ll be able to select multiple settings how the lines look, e.g. color, transparency, dashes as well as choose an icon to act as an anchor point for line elbows.
Optionally, we can also enter a label text to display next to the icons of the line.
When Lines tool is active, clicking anywhere on the map will start adding line-connected points.
We can change any setting while doing so and the it will be applied to subsequently added points/line segments.
If we ever want to come back to editing the line, we can select it from the Map items list.
Each line point is also editable by clicking directly on it.
We can also move points in line by simply dragging them.
Adding Markers
To start adding markers, let’s select Points tool.
Similarly to adding lines, once Points tool is active, clicking on a map will add a marker using currently selected parameters: point type, size, rotation, color, etc. as well as the label attached to it.
To edit current marker, simply click on it in the map or in the “Points” list.
To relocate a marker, simply drag it.
Normally, the markers are “pinned” to the map, so that when the map is moved or zoomed, the markers will move with it.
We can unpin them, so to create static icons.
Adding labels
To add labels, predictably use Labels tool.
Once Labels tool is active, clicking on a map will start adding labels on it using currently selected settings like label color, size, etc.
To edit a label, simply click on it in the map or in the Map items list.
For labels attached to a map point, we can also change alignment in relation to the marker itself.
Using a Resizer Tool
Most of the elements on the map are resizable.
Select Resize then start clicking on elements. Selected element will show a familiar resize bracket, which can be used to change the size of the element or rotate it quickly.
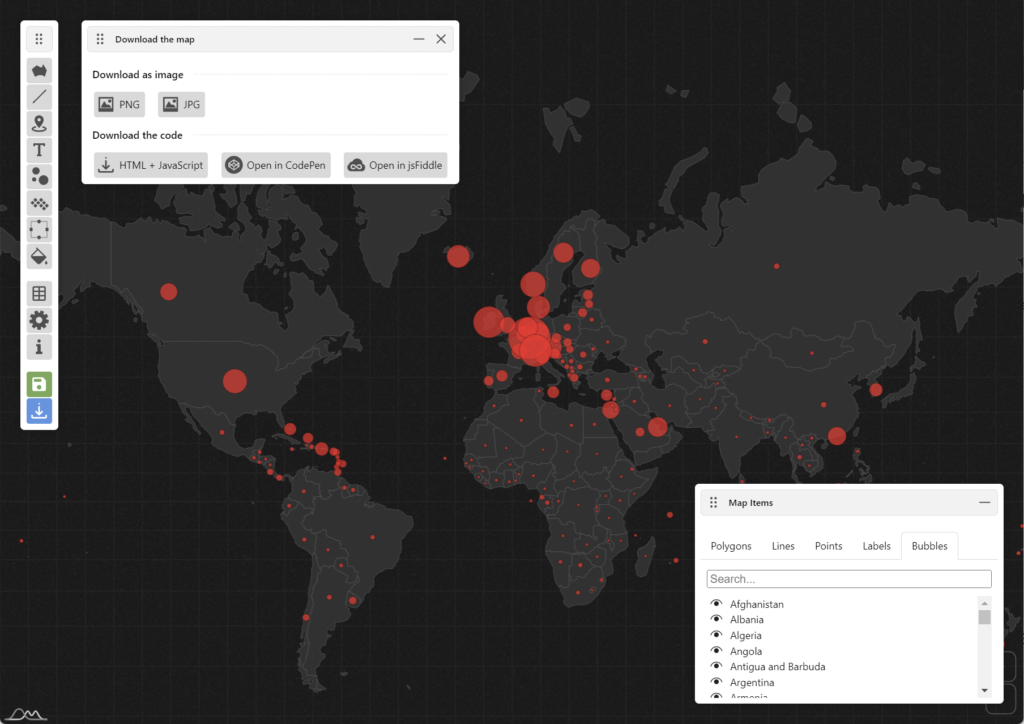
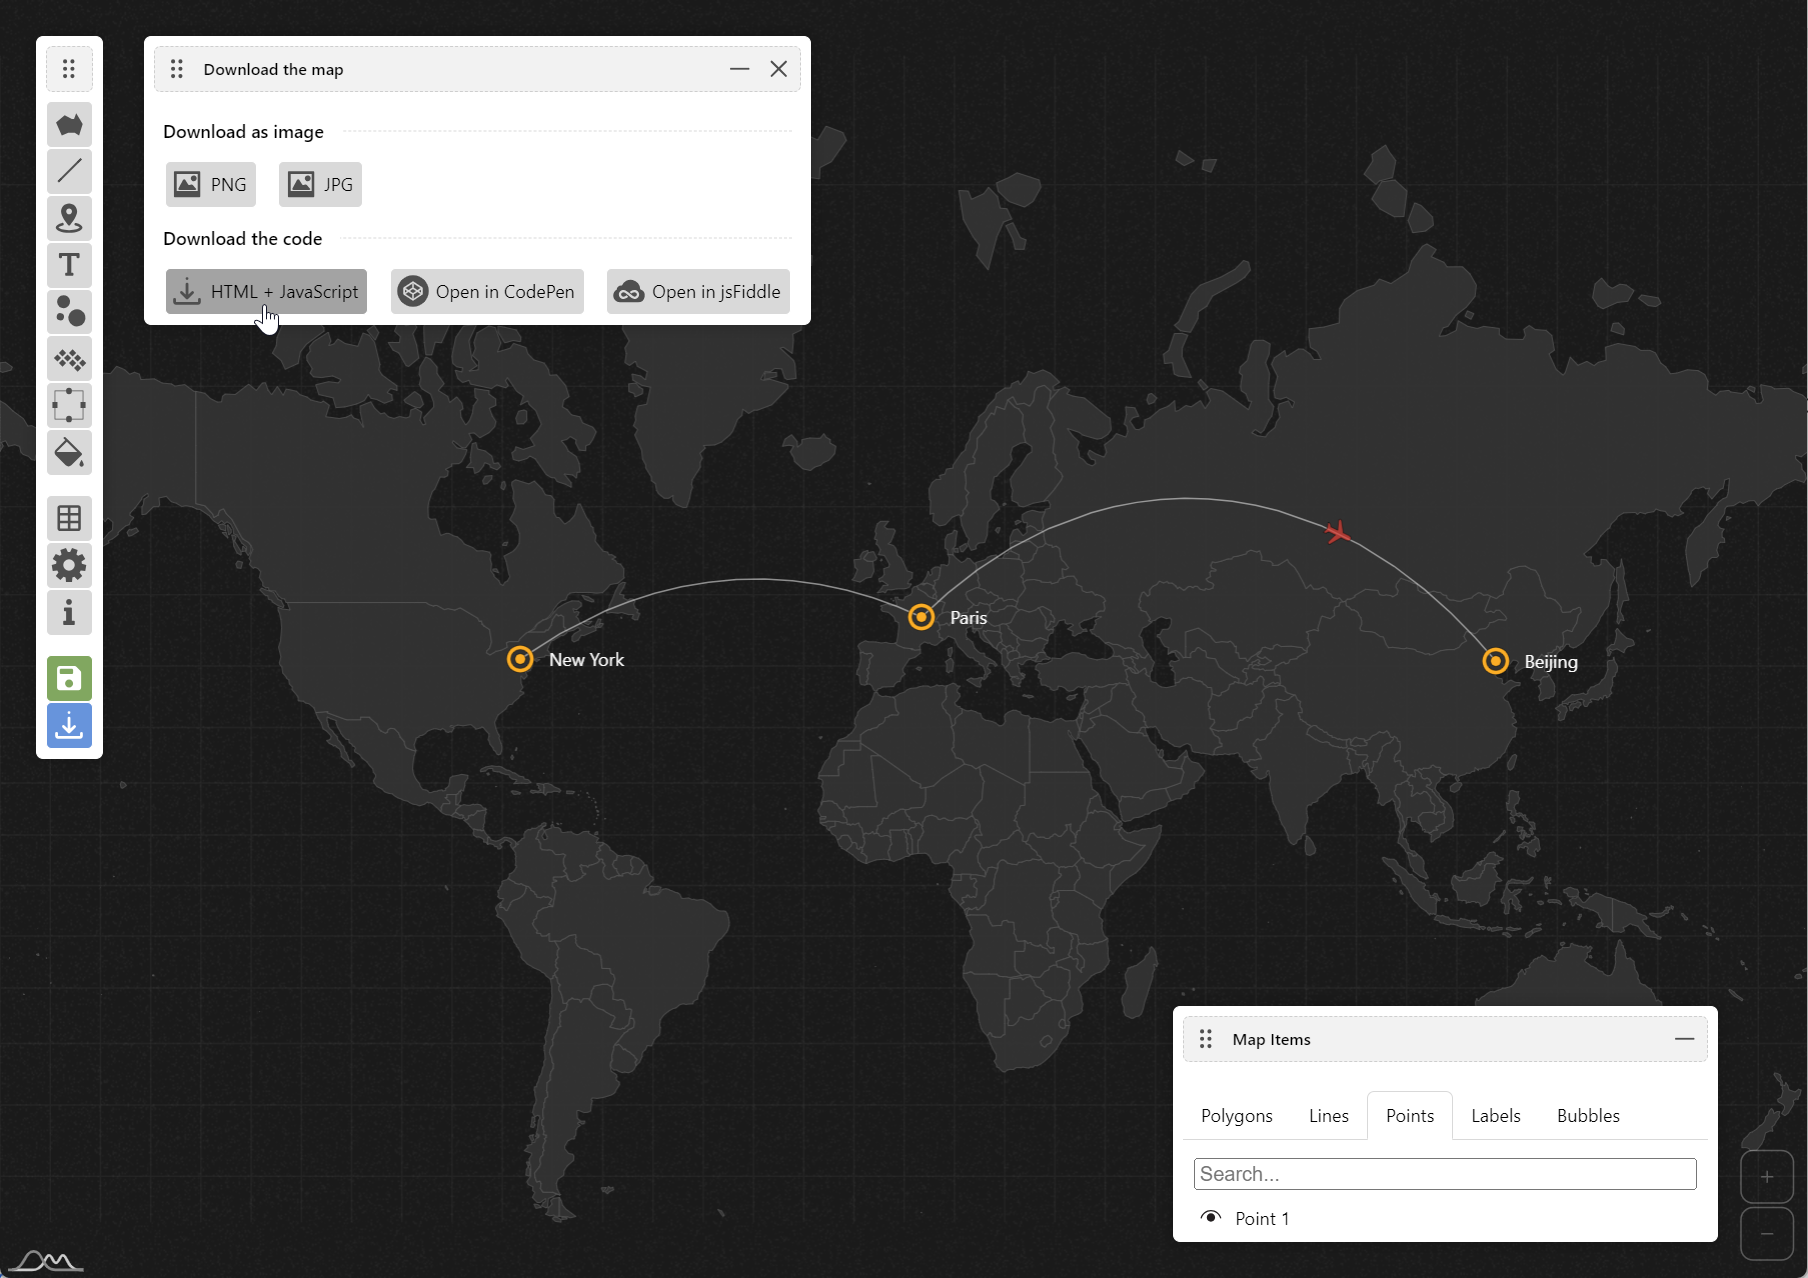
Downloading and Embedding
Once we’re done editing the map, we can download it as a static image, or as interactive code.
The Download tool offers a few options.
PNG and JPG downloads will produce a static image of the map.
HTML + JavaScript option will create an HTML file with full code to reproduce a fully interactive map, which you can embed via <iframe> or grab the code and paste into your own web app or CMD.
CodePen and jsFiddle will open map in those specific services, allowing you to dynamically tinker with the code and data.
Saving and restoring
Let’s open a Save map data tool.
It offers a couple of options for storing our current edits:
Saving it to browser’s memory Once we click on “Save map data” button, all current edits will be saved in browser’s “local storage” and loaded automatically when we come back to the editor the next time.
Exporting raw data Clicking “Export data” will produce raw data for the edits and place it in the text box below. We can copy it and save whenever we want to store it, e.g. in a text file. When we want to restore the edits, we can paste the exported data in the same text box, then click “Import data”.
We can also completely reset the map to defaults using “Reset map” button at the bottom of the same window.
Advanced Usage
Make sure you go over to the following posts showcasing advanced usage of the Map Editor:
Animating Map Markers in Map Editor (coming)
Embedding Interactive Maps Created with Map Editor (coming)
Animations in Map Editor work by assigning a point (marker) to a line which acts as a trajectory for point’s movement.
Creating a Line (Path or Trajectory)
Before we can create animation, we need to create a path for the animated marker to move along.
Think of it as laying a railway.
Adding a Point (Actor)
Now, let’s add a marker which we want to animate.
Attaching a Point To a Line
Now, let’s put our little actor plane on the line we created before.
To do that, we need to select the point, and select our line from the dropdown in point’s edit window.
If we don’t want to animate the point, we can just select its position along the line, and call it a day.
Initiating the Animation
To initiate the animation, we need to set the “Animation duration” control to a non-zero value.
The value means how long (in milliseconds) it should take the point to go from the first point of the line to the last one.
Besides duration – which essentially controls speed of movement – we also have two additional optional animation settings:
Auto-rotate (on by default): if enabled, the points image will flip when it reaches the end of the of the line and continues to animate back towards the start of the line.
Animate back (on by defaulft): if enabled, the point will continue moving between ends of the line in a loop, whereas if it is disable, it will always start from the start and move towards the end.
Hiding the Line (Path)
If we don’t want the actual line or its points to show, we can hide the line by applying zero opacity to its color.
To hide points, we’ll need to set color opacity to both its fill and outline.
If we also added labels to the line points, we can either delete theme one by one, or set color opacity to zero.
Live Example
Here’s a complete working map with animations we have created in the above steps.
The HTML file will contain all the necessary markup, as well as JavaScript files needed to run the map, loaded from amCharts CDN.
Embedding Using Third Party Services
You can use “Open in CodePen” or “Open in jsFiddle” buttons to open your map in those respective services, with their HTML, CSS, and JavaScript sections pre-filled.
You can preview the output, and even edit the code there.
Both of those services allow saving pages (pens or fiddles) then embedding them directly into your websites using easily generated code, which might be an easier alternative to using standalone HTML file.
Please note that am5viewer.create() function takes an id of its target container as the first parameter (in the above example "chartdiv").
Combining With Other amCharts Charts On The Same Page
Normally, viewer.js contains everything we need to run the maps, including amCharts 5 library and related files.
If we need to embed a map into a page that is already using amCharts 5 to create other charts, we can use a “lite” version of the viewer include: viewer.lite.js to make sure amCharts 5 is not loaded twice.
In this case we just need to ensure that all the amCharts 5 files needed to run our map are loaded:
This post is an introduction to new licensing model being introduced by amCharts starting from April 2024.
Throughout the body of this post, we will walk through the new licenses, the reasons for change, as well as how the changes (not) affect current license holders.
TL;DR
The new changes will be rolled out during the day of Sunday, March 31, 2024.
Any licenses or services purchased before that day, are unaffected by the change.
All licenses are now per-seat, meaning that you will need to acquire as many licenses as you will have actual developers working with amCharts product(s) at the same time.
Licenses are now available as annual subscriptions that require renewal every 12 months as well as perpetual licenses that do not expire and do not require renewal.
There are four types of licenses:
Basic – for public websites where users do not have to log in.
SaaS – for SaaS websites where users have to log in.
OEM – for developing redistributable web, mobile, and desktop applications.
Extended OEM – for developing software tools, using across multiple affiliates, and creating “white label” relicensed applications.
No more limits on websites/projects. You purchase only developer seats. It doesn’t matter how many projects (covered by a target license) they are working on. The stuff you create can be used indefinitely even if license subscription runs out.
No changes in product lineup. Three products are still available: Charts, Maps, Stock Chart.
Maps is now a standalone product and does not require a license for Charts.
Support subscriptions (amPlus) are now per-seat, too. A number of seats subscription purchased will determine how many people can contact amCharts support.
Current support subscriptions remain unlimited-seats until their next renewal cycle, whenever that may be.
Current support subscriptions can be renewed using the old unlimited-seats model until midnight July 1st, 2024. After that, all renewals will be switched to the new per-seat model.
Why we are doing it
Having been around for more than 15 years now, we’ve accumulated a vast amount customers of all sizes: ranging from a one-man operation, to Fortune 500 behemoth corporations.
Based on the feedback collected over more than a decade, we’ve came to the conclusion that our one-size-fits-all approach to licensing, while very convenient and straightforward, does not fit the bill (so to speak) anymore.
With that in mind, we’ve set out to design a new licensing approach, which would employ flexible pricing based on the following criteria:
Size of the team working on the project
Duration of the project
The new model should drastically reduce licensing costs for time-limited projects or projects implemented by compact development teams.
Pricing
Full pricing will be announced on March 31st, 2024.
That said, 1 seat pricing will in vast majority of cases lower for perpetual licenses, than they are now, and significantly lower for license subscriptions.
What’s changing
Introducing license subscriptions (in addition to perpetual licenses)
Up until now all amCharts licenses were perpetual: pay once – use forever. That still remains.
We’re also introducing annual license subscriptions: pay a subscription fee – use for 12 months.
As a client, you can control whether you want the subscription to auto-renew for another 12 months automatically, or you will do it manually.
NOTE: Projects created while subscription was active, can remain in use indefinitely. You need an active subscription only when developing using amCharts product(s).
Licenses are now per-seat
Now, when purchasing the license you have ability to choose how many actual developers will be working with amCharts product(s).
For example, if you are developing an SaaS website with a team of 3 developers working on it, you will need 3 x SaaS license for amCharts.
amCharts will provide tools to manage your subscription: add or remove developer seats, cancel or resume subscription, as well as change billing details.
No-more website/project limit
Licenses no longer have a limit on a number of projects/websites they can be used for.
Example: You have 5 public websites you need chart on, and 2 developers developing those websites. You can acquire 2 developers seats for a Basic license for amCharts: Charts.
No changes in product lineup
Three principal products remain:
amCharts: Charts – all chart types like Percent, XY, Radar, etc. (everything excluding Stock Chart and Maps)
amCharts: Maps
amCharts: Stock Chart
OK, a small change regarding amCharts: Maps
amCharts: Maps is now a standalone product (not an add-on to amCharts: Charts) requiring only its own license to operate.
If all you need is to display geographical maps (MapChart), you need only one product – amCharts: Maps.
How current licenses are affected
Any license purchase made before the switch during March 31st, 2024 is not affected. Meaning:
The end-user license agreement that was in effect during the purchase will remain so indefinitely.
No per-seat limit will be imposed on those licenses.
The licenses still remain perpetual and will not expire.
Technical support subscriptions
Technical support subscriptions – amPlus – will also take on a per-seat approach.
The number of seats purchased will determine how many distinct people from your organization will be able to contact amCharts support service.
amCharts will provide online tools to easily manage the list of email address covered by your support subscription.
Some license purchases will include complimentary support subscriptions, as per below table:
License type
Basic license
SaaS license
OEM license
Extended OEM license
Subscription
Support pricing:
Extra fee
Support pricing:
Included
Support pricing:
Included
Support pricing:
Included
Perpetual
Support pricing:
Extra fee
Support pricing:
First year: Included Renewals: Extra fee
Support pricing:
First year: Included Renewals: Extra fee
Support pricing:
First year: Included Renewals: Extra fee
Current active subscriptions will accommodate unlimited seats condition until at least their next renewal date.
At this time we plan on keeping renewals with the old conditions until July 2024. Any renewals to old subscription before July 2024 will retain the unlimited-seats model.
Subscriptions expiring after midnight of July 1st, 2024 will need to be switched to the new per-sear support subscriptions.
When is this happening?
We’re implementing changes on Sunday, March 31st, 2024. There are a lot of moving parts to consider, so changes will appear gradually.
We strongly advise to hold off from purchases on March 31st.
If you still need to purchase an old-style license, do it on March 30 or earlier. Or wait for April 1st.
Frequently asked questions
What happens if I need to add developer seats mid-project?
You will be able to do so using subscription management tools.
For active subscriptions, adding new seats will create a new charge, pro-rated based on the time remaining to the next renewal.
And what if I need to remove seats from subscription?
You can do so, too. However, we won’t be able to refund you the amount for the remaining subscription period.
The new seat count will take effect with the next billing cycle.
How can I specify users who will be able to access license information as well as contact support?
amCharts will provide online tools where you will be able to edit a list of email addresses that can see license information when logged into amcharts.com, as well as a list of address that can contact amCharts support under your support subscription.
Since version 5.9, Stock Chart from amCharts features a fully revamped and enhanced functionality for drawing on and annotating the charts. Let’s take a look at the highlights.
Stock Chart Drawing Mode
Drawing mode – which supports over 20 annotation tools – can be turned on either via Stock Toolbar, or via API.
Available Tools
Stock Chart currently brings more than 20 tools that can be used to annotate and analyze stock charts:
Arrows & Icons
Average
Callout
Doodle
Ellipse
Fibonacci
Fibonacci Timezone
Horizontal Line
Horizontal Ray
Label
Line
Measure
Parallel Channel
Polyline
Polyfill
Quadrant Line
Rectangle
Regression
Trend Line
Triangle
Vertical Line
Tool Selection & Drawing
A tool can be selected from the dropdown list.
The context-sensitive control next to it will automatically update to show only relevant related controls like line color and style for lines, or font family and size for labels, etc.
Selecting & Moving Drawings
Using Select mode, each of the drawings can be selected and moved by dragging in.
Moreso, multiple drawings can be selected by holding down CTRL key when clicking on them.
Modifying & Deleting Drawings
Selected drawings can be edited by choosing different values from related controls, like colors and line styles.
The styles will be applied to all selected drawings. Pressing DEL key, will delete them.
Analytical Annotations
Tools offered by he Stock Chart go beyond simple annotations. They also offer powerful analytical tools like variations of Fibonacci analysis, Average, Regression, and Trend lines, Parallel Channel and Measure tools, etc.
Events and API
Everything that can be controlled via Stock Toolbar, can also be triggered via the chart’s API:
Selecting tools as well as setting properties like colors, line styles, fonts, etc.
Deleting drawings
Toggling select, drawing, and erasing modes.
Serializing and restoring drawings.
Stock Chart also provides a robust event structure which allows triggering custom handlers when drawings are added, selected, moved, or removed.
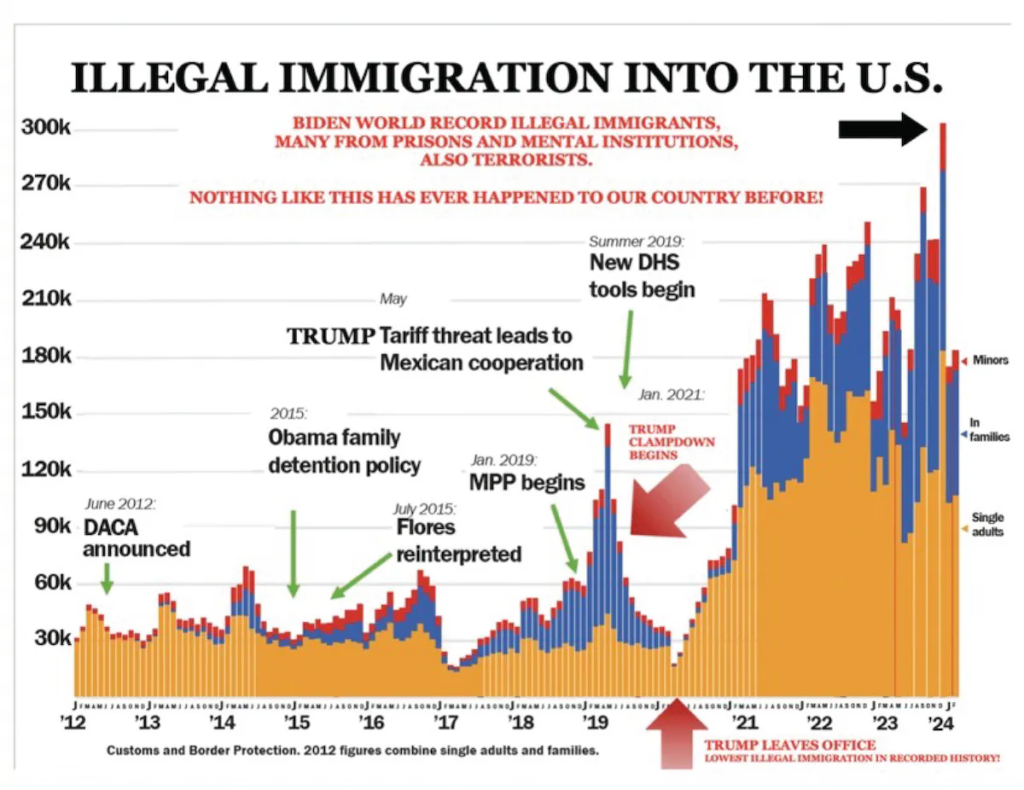
We always knew that data-viz was bringing beauty and order to the world. As of July 14th, 2024 it also can claim a badge of the Secret Service officer, having successfully saved a presidential candidate’s life.
The Background
During rally, presidential candidate Donald Trump has looked away towards this chart displayed on a big screen, titled (in all caps as we come to expect) “ILLEGAL IMMIGRATION INTO THE U.S.”:
At the same time a shot, aimed at Trump’s head was fired, and missed, because he was looking away at the chart.
As he later claimed himself, the chart saved his life.
The Task
While the information conveyed in this specific chart is *** ahem *** questionable, we can’t resist giving prominent data-viz items an amCharts makeover.
Behold, a live version of the life-saving chart:
See the Pen
Column with Rotated Labels by amCharts team (@amcharts)
on CodePen.
Editable Version
And should you feel creative, here’s a version of the same chart that you can manipulate the data on, by dragging the columns. Enjoy! 😉
See the Pen
Column with Rotated Labels by amCharts team (@amcharts)
on CodePen.
On January 30, 2025, around 15:00 GMT, amCharts servers were targeted in a coordinated distributed denial-of-service (DDoS) attack.
As a result, most amCharts services, including our website (amcharts.com) and CDN service (cdn.amcharts.com), were unavailable for several hours.
We took all possible measures to restore these services as quickly as possible.
There is no evidence that any servers were breached or that any data was leaked or damaged.
We are actively reviewing the incident and working on ways to minimize the likelihood of similar occurrences in the future.
In the meantime, our small team is immensely grateful to our users for their patience.
While all services are now back online, we urge our users to remain vigilant. Based on similar incidents affecting other businesses, there may be follow-up attacks, including further denial-of-service attempts and false claims about data leaks.
If such incidents occur, we will do everything in our power to mitigate them and investigate any claims.
We strongly recommend deploying amCharts libraries on your own web servers instead of relying on our public CDN. (downloads page)
As a good measure, we also encourage to log into your amcharts.com account, and changing password to something unique, in order to not be vulnerable for cross-referencing with reused credentials on other websites that had their user data bases leaked.
If you have questions, or have other concerns, please feel free to reach out to us at contact@amcharts.com.