Quantcast
Channel: Blog - amCharts
Viewing all 101 articles
Browse latest View live

Potentially breaking change in amCharts 4.1

$
0
0

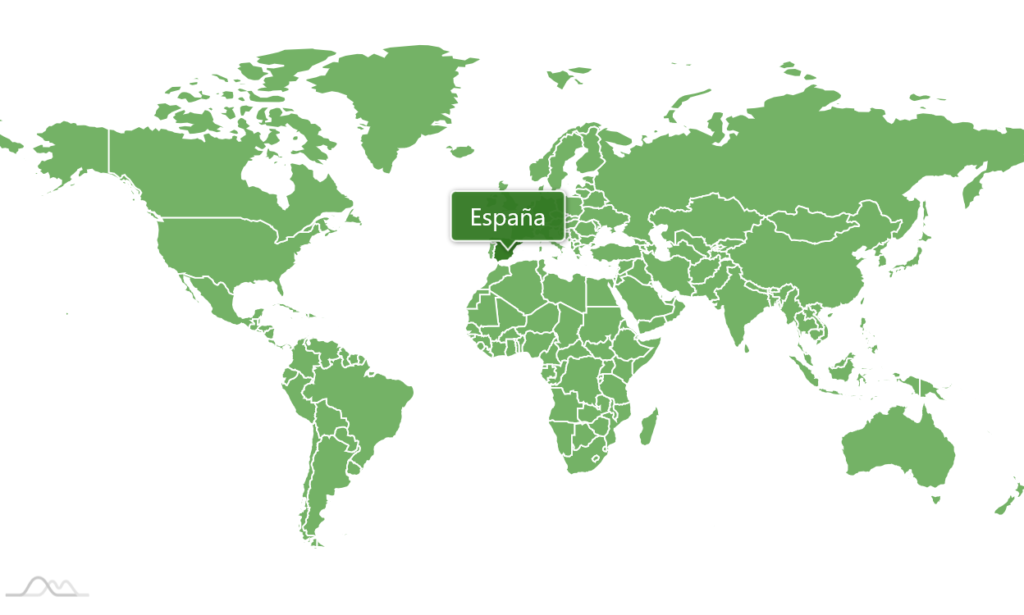
In order to avoid potential conflicts with other Webpack-bundled libraries, we had to make some changes to how amCharts geo-data is packaged and release a new version of the libraries. This means that new geo-data (4.1+) is incompatible with amCharts 4.0.x and vice versa.

So, if you are using amCharts map charts with amCharts geo-data via script tags, please make sure that both are v.4.1.x or keep both at 4.0.x. Those utilizing TypeScript/ES6 modules are unaffected.

Check out our download page for ways to obtain the newest versions.

Other fixes in v.4.1.0

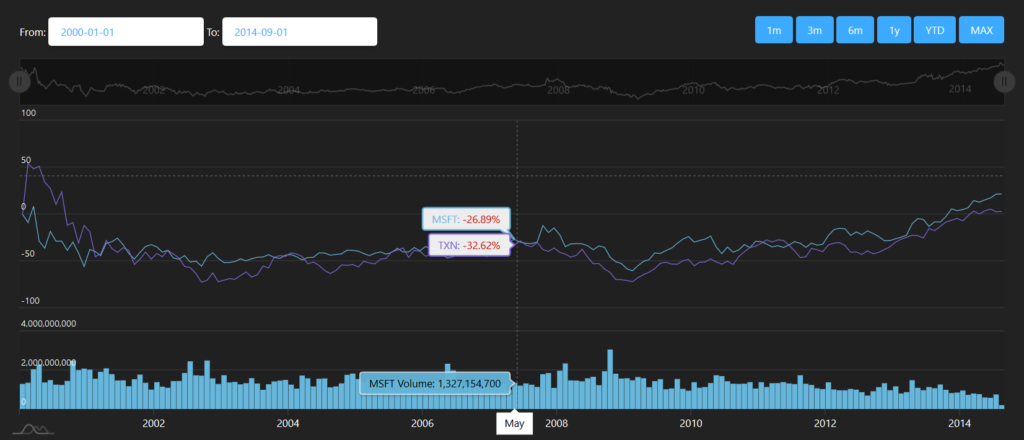
  • Performance optimizations of date-based charts, especially with more than one series.
  • Overlapping tooltips of series with gaps in date-based data fixed.
  • Bullets were not hidden when series was hidden in some cases.
  • simplifiedProcessing moved from ColumnSeries to Series. If set to true (default false) the chart will not auto-calculate derivative values for data items, like sum, average, change, etc.
  • Last grid of monthly data was not always drawn.

The post Potentially breaking change in amCharts 4.1 appeared first on amCharts.


Multi-panel-like charts with amCharts 4

$
0
0

amCharts supported multiple value axes since the early versions. “Classic” multi-value-axis chart positions axes next to each other:

See the Pen Multiple value axes by amCharts team (@amcharts) on CodePen.0

With amCharts 4 you can take multi-axis charts to the next level by spreading axes vertically or horizontally:

See the Pen Stacked value axes by amCharts team (@amcharts) on CodePen.0

You achieve this by simply setting chart.leftAxesContainer.layout = "vertical" in the example above. Or chart.bottomAxesContainer.layout = "horizontal"; in the demo below:

See the Pen Horizontally stacked axes by amCharts team (@amcharts) on CodePen.0

This way you can display multiple series with a common category axis without subjecting your viewers to a bunch of overlapping series.

The post Multi-panel-like charts with amCharts 4 appeared first on amCharts.

Putting labels on a path, bending circular labels, and more in amCharts 4.1.2

$
0
0

Just released amCharts 4.1.2 includes a few new awesome features in addition to fixes and improvements.

Labels on a path

Now you can put a label right on the series path and it will bend as the graph curvature bends. This is done using the new path and locationOnPath properties of the Label. Here’s a simple example:

See the Pen Label on a path by amCharts team (@amcharts) on CodePen.0

You can take it to the next level and animate the label to move along the graph’s path:

See the Pen Funky text on a path by amCharts team (@amcharts) on CodePen.0

Bent circular labels

You can now use a boolean bent property on the AxisLabelCircular to bend the label along the shape of a circular chart:

See the Pen Bent circular labels by amCharts team (@amcharts) on CodePen.0

Other additions, changes and fixes

Here’s what else is new in amCharts 4.1.1 and 4.1.2:

Added

  • New Sprite property strokeDashoffset added. Can be used in conjunction with strokeDasharray.
  • Label has two new properties: path and locationOnPath. If set, will layout the SVG text along a curvature of the SVG path. HTML and multi-line text is not supported.
  • AxisLabelCircular new property bent added. If set to true, the label will be bent to follow the curvature of the circle. Distance from the circle can be adjusted using radius and label.paddingBottom. For PieSeries the alignLabels need to to be set to false for this feature to work.
  • keepSelection added to ValueAxis (will work on DateAxis too). With this set to true, axis will keep the relative selection when data changes (is updated). This is useful for “pre-zooming” a date axis: just set it’s start property (e.g. axis.start = 0.8).

Changed

  • If ValueAxis has strictMinMax = true set but min and max are not set, axis will fix the min and max and real high/low values.

Fixed

  • JSON: Having property values with both percent and minus signs in them, was resulting in error.
  • “Z” code in DateFormatter was not taking UTC setting into account.
  • Exporting SVG with Unicode characters in Edge/IE was resulting in invalid SVG.
  • Fixed JavaScript error which used happen when disposing chart/changing data in some cases.
  • Gantt chart sometimes was not displaying first/last data item.
  • Newly added MapLine elements were not respecting nonScalingStroke = true until zoom level changed.
  • Series’ tooltip was not always visible with DateAxis.
  • cursorTooltipDisabled = true was not working properly in some cases.
  • Sometimes duplicate MapLineObjects used to appear on map lines.
  • Some fixes made so that vertically and horizontally stacked axes on XYChart are now possible. Check new example in examples/vertically-stacked-axes.

Get the latest amCharts

As always, you can get the latest version of amCharts by following one of the methods outlined on our Download page.

The post Putting labels on a path, bending circular labels, and more in amCharts 4.1.2 appeared first on amCharts.

Create Sunburst Diagrams with amCharts 4.1.6

$
0
0

The just released version 4.1.6 of amCharts 4 adds a plugin enabling you to create Sunburst diagrams:

See the Pen Sunburst-demo by amCharts team (@amcharts) on CodePen.0

Sunburst diagrams represent hierarchical relational data in a circular chart. They look similar to nested donut charts, however, the hierarchical nature of the Sunburst means that each level represents detalization of the previous one. In other words, children slices on each level comprise the whole of the parent slice.

Check out the Anatomy of a Sunburst Diagram to learn all you need to know about Sunburst diagrams in amCharts 4 and get the latest version to get started.

Change log for versions 4.1.3 to 4.1.6

Added

  • New plugin chart type: Sunburst!
  • New Sprite adapter: criticalError. Takes Error object as an argument. Modify it’s message property.
  • New property contextMenuDisabled (default false) added to Sprite. If set to true it will prevent context menu (such as one displayed on right click) from displayed.
  • DateAxis.gridInterval accessor added. Returns current grid interval.

Changed

  • Setting data on ColorSet will now automatically reset iterator.

Fixed

  • Export was somewhat broken in Angular apps or pages with <base> since 4.1.5.
  • DateAxis was not positioning elements properly when spanning switch to/from daylight savings time.
  • valign property of the horizontal axis labels now work properly.
  • "rightclick" event was essentially not working.
  • Angular with router enabled were breaking charts in Safari and older Firefox.
  • Calling useTheme() with the same theme multiple times used to cause that theme applied multiple times as well.
  • Sometimes ValueAxis would not zoom-out to show new selected range when data was updated.
  • Sometimes axis fills were not visible after zoom-in / zoom-out.
  • totalPercent was not properly calculated with negative values.
  • ExportMenu items will be revalidated if data of the chart is updated. This helps avoid missing “Data” export items in menu if data is loaded later than the chart itself.
  • In stacked axes setup axis tooltips were shown in wrong positions.
  • Preloader was not always shown when needed.
  • JavaScript error when hovering cursor over missing data items fixed.
  • TreeMap data change performance improved.
  • Horizontal ZoomControl (layout = "horizontal") button text vertical align fix.
  • Accellerated panning of zoomed-in axis problem fixed.

The post Create Sunburst Diagrams with amCharts 4.1.6 appeared first on amCharts.

Create Amazing Word Clouds with amCharts 4.1.10

$
0
0

See the Pen Word Cloud by amCharts team (@amcharts) on CodePen.0

Visualizing frequency of words or popularity of tags in a chart known as WordCloud is a great way to emphasize certain aspects of your texts or data.

amCharts 4.1.10 includes a brand new powerful plugin for creating amazing animated interactive Word Clouds. You can learn how to get started with amCharts WordCloud in the Anatomy of a WordCloud article in the documentation.

Get the newest version of amCharts 4 here and start experimenting with WorldCloud and other awesome chart types.

Here’s a complete change log for versions 4.1.7 through 4.1.11

Added

  • New chart type: WordCloud.
  • New Sprite property: baseSprite. On objects, even deep in hierarchy it will contain a reference to the main chart object.
  • JSON: You can now specify both list of items and template settings for ListTemplate, e.g.: titles: { template: { ... }, values: [{ ... }] }. Specifying it the old way will still work.

Changed

  • Default value of minFontSize in WordCloudSeries to 2%.
  • Default value of maxFontSize in WordCloudSeries to 20%.
  • Label sizing algorithm updated in WordCloudSeries.
  • Rotated axis labels (rotation != 0) of the vertical and horizontal axes no longer have their verticalCenter and horizontalCenter overridden by renderer. This gives more freedom for positioning rotated labels.
  • Axis min/max calculation algorightm updated.
  • DateAxis will now pay attention to dateFormatter.firstDayOfWeek when grid is in “weekly” mode.

Fixed

  • exportable = false was not working when set on various Series item templates.
  • On Gantt chart date axis tooltip was snapping randomly when moving mouse.
  • Export: For very large data sets (2MB and up) data export was failing silently in Chrome.
  • On a chart with DateAxis and multiple series with same-date data items, bullets could sometimes disappear while scrolling the chart.
  • On DateAxis with yearly granularity could sometimes show wrong year.
  • Updating chart data with less data points was sometimes resulting in JavaScript error.
  • DateAxis labels/ticks/grid was not placed in the correct position if baseInterval.count > 1 and location > 0.
  • Dynamically changing ZoomControl value of layout was not working correctly.
  • Using proprtyFields on a LineSeries sometimes could result in an error. (fix by @AndiLi99)
  • French locale (fr_FR) updated for correct decimal/thousands separators.
  • Export: scale in image export options was being ignored.
  • JSON: cursor.snapToSeries was not working in JSON configs.
  • Selection was acting funky when zooming DateAxis and cursor moved out of plot area.
  • An infinite error message loop fixed which was happening if series was added and there was no X or Y axes defined.
  • Tooltip on the last available data item was left visible even if cursor moved to the date where the series had no data points.
  • When snapToSeries was enabled in XYCursor, vertical line was not shown.
  • Issue 933.
  • DateAxis sometimes could show date/time in UTC even if not explicitly enabled.

The post Create Amazing Word Clouds with amCharts 4.1.10 appeared first on amCharts.

Responsive Layout Control with amCharts 4.2

$
0
0

Today we have released amCharts 4.2 which, among other things, includes new responsive layout features. Read all about responsive layout in amCharts 4 in this document.

Another highly requested feature is the ability to export multiple charts at once.

Get the latest amCharts version now.

Complete Changelog for versions 4.1.11 – 4.2.0

Added

  • Added read-only property of CategoryAxis: frequency. Indicates every X label is shown.
  • Added JSON example of Candle stick chart (json/candlestick-series).
  • New Export property: extraSprites. May contain a list of references to other Sprites (e.g. external legend or even other chart) to attach to exported image. More info.
  • Experimental responsive features and default rules are now active. More info.
  • New Tooltip proprety: keepTargetHover – will make target element hovered as long as its tooltip is hovered, good for bullets and map images.
  • New Tooltip proprety: targetSprite – contains reference to element this tooltip is displayed for, if any.
  • New PictorialStackedSeries properties: startLocation and endLocation – allow setting relative start and end positions of the shape to fill.
  • New FunnelSeries/PyramidSeries/PictorialStackedSeries property: labelsOpposite – allows controlling which side of the series to show labels when alignLabels = true.

Changed

  • Accessibility: Default role of the Legend’s item containers was changed to “switch”.
  • Hiding or showing an element will now automatically set its readerHidden attribute accordingly.
  • On MapPolygon default value of nonScalingStroke is now set to true (as false).
  • When calculating font size for a word on a WordCloud chart it now uses smaller side of the series area instead of height.
  • Tooltip‘s label paddingBottom default value changed from 6 to 4 pixels for better centering of text.
  • Default value of minFontSize in WordCloudSeries to 2%.
  • Default value of maxFontSize in WordCloudSeries to 20%.
  • Label sizing algorithm updated in WordCloudSeries.

Fixed

  • Accessibility: Legend’s containers when toggling items were setting value of aria-checked incorrectly.
  • JSON: Using children with an array value was duplicating elements.
    Working around a bug with Angular’s dead code elimination in --prod mode.
  • Fixed ValueAxis issue with animation when there’s only single data item.
  • Sometimes axis ticks on a chart with a lot of data/series were not positioned properly.
  • Sometimes baseInterval = "year" on a DateAxis could cause stack overflow.


The post Responsive Layout Control with amCharts 4.2 appeared first on amCharts.

A Massive Maps Upgrade in amCharts 4.3

$
0
0

The just-released amCharts 4.3 includes a slew of exciting updates to maps functionality. From new projections to the additional rotation and panning features and more, the new release delivers a bunch of exciting goodies for those investing in map charts.

You can start using all of these features right away. Or check the updated Anatomy of Map Chart article in the documentation for technical details.

Here’s the complete list of what was added, changed and fixed in version 4.3:

Added

  • MapChart can now use any projection supported by d3-geo. Projection.d3Projection property added and you can set any d3-geo projection using it, like: mapChart.projection.d3Projection = am4maps.d3geo.geoConicEquidistant();.
  • Albers, AlbersUsa, AzimuthalEqualArea, EqualEarth, NaturalEarth1, Stereographic projection classes added (use them regularly like: mapChart.projection = new EqualEarth()).
  • deltaLatitude, deltaGamma added to MapChart. Together with already existing deltaLongitude allows rotating maps in any possible direction.
  • panBehavior property added to MapChart. Values: “move” (default), “rotateLat“, “rotateLong”, “rotateLongLat”. Indicate what should happen when map is dragged.
  • ignoreBounds added to MapSeries. Specifies if this series must be included when calculating bounds of the map.
  • calculateVisualCenter added to MapPolygonSeries. Specifies if map polygons should calculate their visual center. Visual center is good for placing labels.
  • visualLongitude and visualLatitude getters added to MapPolygon. They return coordinates if calculateVisualCenter of series is set to true. You can also set them manually.
  • getCircle() and getBackground() methods added to MapUtils.
  • Graticule and GraticuleSeries classed added. Those allow creating graticules (map grid).
  • backgroundSeries added to MapChart. Allows creating a map-shaped background fill.

Changed

  • Engine behind rendering of maps was changed to use d3-geo.While the change should be ackwards compatible, beware of and report any issues.
  • day-night-map and morphing-countries demos we changed to work properly with new version.
  • When adding a HeatLegend to MapChart its valign = "bottom" is no longer set by default. Set it explicitly if you need legend to bottom-aligned.

Fixed

  • rtl setting was not being inherited properly.
  • Fixed RTL behavior for labels.
  • Disposing a hovered chart with scroll pan enabled used to leave whole document with disabled wheel scroll.

The post A Massive Maps Upgrade in amCharts 4.3 appeared first on amCharts.

Albers USA Projection is Here

$
0
0

The support for highly requested Albers USA Projection is now included in amCharts.

See the Pen amCharts 4: Albers USA projection by amCharts team (@amcharts) on CodePen.0

Albers USA projection enables regular maps of United States to be depicted in their most common form – with states of Alaska and Hawaii placed right below the mainland USA.

Check out this article on how to enable Albers USA projection and start using it today.

The post Albers USA Projection is Here appeared first on amCharts.


Create Hyperbolic Trees, Packed Bubbles, Mind Maps, Network Diagrams, and other force-directed charts with amCharts 4.3.8

$
0
0

The recent update to amCharts 4 comes with a ForceDirectedTree plugin that lets you create a bunch of new and exciting chart types.

See the Pen Force-directed network by Alan Mendelevich (@ailon) on CodePen.0

Force-Directed Tree is a special kind of chart used to display of multi-item data related in a hierarchical, linear or mixed way, as a series of linked bubbles.

You can find more demos of force-directed charts created with amCharts 4 here, here, here and here.

Learn the ropes of how to create your own amazing force-directed tree charts in this exhaustive article in the documentation.

And download the latest version of amCharts 4 to start experimenting.

The post Create Hyperbolic Trees, Packed Bubbles, Mind Maps, Network Diagrams, and other force-directed charts with amCharts 4.3.8 appeared first on amCharts.

Improved Touch Experience in amCharts 4.4

$
0
0

The just released version 4.4 of amCharts includes two new ways to improve user experience on touch-enabled devices. Touch interactions with charts can interfere with desired interactions with the containing page and vice versa. amCharts 4.4 addresses these issues.

One option lets you switch touch into a tap-to-activate mode – touch interactions are enabled only after the user taps on the chart and are disabled after a period of inactivity.

The other option enables a special “grip” control that helps users scroll the containing page with no ambiguity as to which element should handle touch.

Check out all the details about these features in the documentation.

Download the latest version to enable them.

Refer to the complete change log for other additions, improvements and fixes.

The post Improved Touch Experience in amCharts 4.4 appeared first on amCharts.

New: Annotation Plugin in amCharts 4.5.5

$
0
0

Starting with version 4.5.5 you now have an option to add annotation feature to your charts. Annotation plugin enables users to draw, write and add markers on top of the chart.

Consequently, the annotated visual can be serialized and reloaded later, or exported as an image to be shared with other team members, customers or other parties.

Check out this extensive guide in the documentation to find out how to enable and configure the Annotation plugin.

For a live demo of the plugin in action click here.

The post New: Annotation Plugin in amCharts 4.5.5 appeared first on amCharts.

Introducing the Bullets plugin

$
0
0

amCharts 4.5.7 comes with a new and awesome Bullets plugin enabling you to add configurable shapes as bullets to your charts, markers to your maps, and anything anywhere else for that matter.

In addition to getting the great plugin, you also get a visual configurator where you can adjust and preview your custom bullets.

  • Get the plugin with the amCharts 4.5.7 or newer here.
  • Read more about it here.
  • Visually configure your bullets here.

The post Introducing the Bullets plugin appeared first on amCharts.

Place Bullets on Axes with amCharts 4.5.9

Improve user experience and performance with dynamic data grouping in amCharts 4.7

$
0
0

The just-released amCharts 4.7.0 introduces a very attractive and important way of automatically grouping data values. We call it dynamic data item grouping and you can read all the details about it in the documentation here.

Where is dynamic data grouping useful?

Suppose you have 10 years’ worth of daily data to plot. That’s about 3.6K data items right there.

Plotting all of those thousands of data points on a chart that’s, say, 1000 pixels wide is not only useless (user would not be able to see all those points) but also poses a performance issue (more objects, slower chart).

The dynamic grouping feature tackles this issue by automatically grouping data items into larger periods, using some configurable aggregate value.

Where can I see it in action?

Check out this stock chart demo that uses dynamic item grouping to create a stock chart that would require a specialized stock charting library previously. In addition to dynamic data item grouping, it also showcases auto-calculated derivative values, and stacked axes allowing for a multi-panel interface.

That’s great! How do I start using dynamic data item grouping?

  1. Make sure that you have amCharts 4.7.0 or newer.
  2. Read the documentation for the data grouping feature and check out the code in the demo.
  3. Apply your newfound knowledge in your creations!

The post Improve user experience and performance with dynamic data grouping in amCharts 4.7 appeared first on amCharts.

Localized country names and US congressional districts in the latest amCharts 4 release

$
0
0

The just-released version 4.7.4 of amCharts includes some great improvements to the map chart experience.

Country name translations

Now it’s easier than ever to localize country names shown on the map along with the rest of your application. Just make sure that you have amCharts 4.7.4 or newer and amCharts 4 Geodata v.4.1.8 or newer, and follow the steps in the documentation to switch the language of the country names.

US congressional district maps

Another great addition to mapping in amCharts are congressional district maps for the United States. They are included with amCharts 4 Geodata starting from version 4.1.8. Using them is as straightforward as with any other amCharts maps. Head over to this tutorial to find all the details.

As usual, you can get the latest version of amCharts in your preferred way through our downloads page.

The post Localized country names and US congressional districts in the latest amCharts 4 release appeared first on amCharts.


Create Venn Diagrams with amCharts 4.9

$
0
0

Venn diagrams are a great tool to show relationships between data sets as well as a great source for all kinds of internet memes.

See the Pen amCharts 4: Simple Venn Diagram with patterns by amCharts team (@amcharts) on CodePen.default

Starting with amCharts 4.9 you can add great interactive Venn diagrams to your web applications.

Check out the demos here. And make sure to read through Anatomy of a Venn Diagram in the documentation.

Start creating Venn diagrams by downloading the latest version of amCharts 4.

The post Create Venn Diagrams with amCharts 4.9 appeared first on amCharts.

Add Chart Editing To Your Web Apps With amCharts Editor 4

$
0
0

amCharts Editor version 4.0 is out now! amCharts Editor 4 enables you to integrate a powerful WYSIWYG chart configuration tool into your web applications. End-users and developers alike can now create and modify advanced charts without writing a line of code.

Key features of the amCharts Editor 4:

  • Integrates with your CMS
  • Create chart objects, edit their properties and data
  • Supports most common chart types
  • Powerful and beautiful templates
  • Theme presets

Read more about amCharts Editor 4 and get it here. You can also play with the live demo here.

Introductory offer

Until the end of 2020 you can get a license for amCharts Editor 4 with a 50% discount. Head to our online store to take advantage of this offer.

The post Add Chart Editing To Your Web Apps With amCharts Editor 4 appeared first on amCharts.

amCharts 5 Beta is available now!

$
0
0
amCharts 5 Beta

Regardless of which version of amCharts library you are currently using, we have an update for you: amCharts 5 Beta is available for immediate use now.

amCharts 5 is a natural successor to previous versions, and is better in a lot of ways:

Blindingly fast

amCharts 5 uses canvas technology to deliver crisp charts, quickly. It also uses lightweight data objects, to minimize memory footprint and save on processing time. Animations are silky smooth, delivered at tens of frames per second.

Super light-weight

For JavaScript users the core binary package is just around 400K.

TypeScript and framework developers will appreciate how well tree-shaking works.

Dashboard-friendly

amCharts 5 is the best data-viz library for dashboards, since they initialize very quickly.

Having a lot of charts in your dashboard will not bog down the browser anymore.

New chart types

We’ve added new chart types, too.

Pack, Tree, Partition, and full-fledged drillable Sunburst Diagram among others.

Get started with amCharts 5 now!

For more information, demos, links, documentation, and downloads, click the button above, or visit amCharts 5 intro page.

Try it out, but remember: it’s a Beta. If you find any bugs, ping us or file an issue in GitHub repo.

Now, boring stuff about licenses…

Do you have an amCharts license?

If you’ve bought App/SaaS, OEM, or Extended OEM license for amCharts 4 on or after September 1st, 2020, or have an active amPlus subscription to go with your license, the upgrade is yours. Free. No strings attached.

If your license is older, or have a Single website license, upgrading to amCharts 5 is as easy as renewing your amPlus subscription.

No license yet?

If you don’t have any license at all, grab one for amCharts 4 from our Online store and enjoy free immediate upgrade to amCharts 5.

Not sure?

If you’re not sure whether you qualify for a free upgrade, or want to purchase a renewal for amPlus, try logging into our Support area and checking My Downloads section, or simply email us at contact@amcharts.com and we’ll figure it out for you.

The post amCharts 5 Beta is available now! appeared first on amCharts.

amCharts 5 is here!

$
0
0

We’ve been hard at work slicing, dicing, mixing, and seasoning. Then we put our creation in the oven. And now the timer has beeped and the freshly cooked amCharts 5 are ready for your consumption!

The one charting library to rule them all

amCharts 5 is a library that covers all your charting needs in one simple, yet extremely powerful, performant, and lightweight package. From classic line and bar charts to advanced Sankey and Chord diagrams, Funnel charts, Treemaps and Heatmaps. And did we mention Geo maps?

Canvas rendering ensures top-notch performance – on another level from what was achievable before. Our internal objects are extremely lightweight now, ensuring speedy data processing and low memory footprint.

Whether you are developing a simple brochure-like website with HTML and JavaScript and need stunning charts to take it to another level or working on a massively complex web application in React, Vue, Angular or another framework, and need top notch feature set, flexibility, and performance, amCharts 5 has you covered.

See and try it for yourself

Enough trying to describe a beautiful picture with a thousand words. Just head over to our demos section and see amCharts 5 for yourself.

Then head to downloads and choose the most appropriate way to get started enhancing your web creation.

Spread the word and let us know what you think!

The post amCharts 5 is here! appeared first on amCharts.

Gapless Date Axis, Time Zones, and More in amCharts 5.1

$
0
0

amCharts 5.1 has just gone live and it adds several key features in addition to bug fixes and smaller improvements.

Gapless Date Axis

Gapless Date Axis

If you have date-based data that has substantial gaps in it (like nights, weekends, holidays, etc.) you will appreciate GaplessDateAxis. It combines the best of what regular DateAxis can offer (like data grouping and date formatting) with no-nonsense (aka not showing what’s not in the data) approach of the CategoryAxis.

GaplessDataAxis is a drop-in replacement for DateAxis, meaning they have the same API and can be used interchangeably. Learn more about GaplessDateAxis in the documentation and check out the demo.

Time Zones

Displaying of time-based information can now be adjusted to a specific time zone. Check the docs for details.

Other Fixes and Improvements

Find out about other improvements in amCharts v5.1 in the official changelog.

Get It Now!

Head over to the Download section of our website for all the ways to start using version 5.1.

amCharts 5.1 is a free upgrade for all amCharts 5 license holders.

The post Gapless Date Axis, Time Zones, and More in amCharts 5.1 appeared first on amCharts.

Viewing all 101 articles
Browse latest View live